How to read a patient monitor, step by step
Staring at six numbers at once does not work. Experienced nurses and doctors go through the screen in the same order every time, and that is why they spot the one thing that is off. Here is the order.
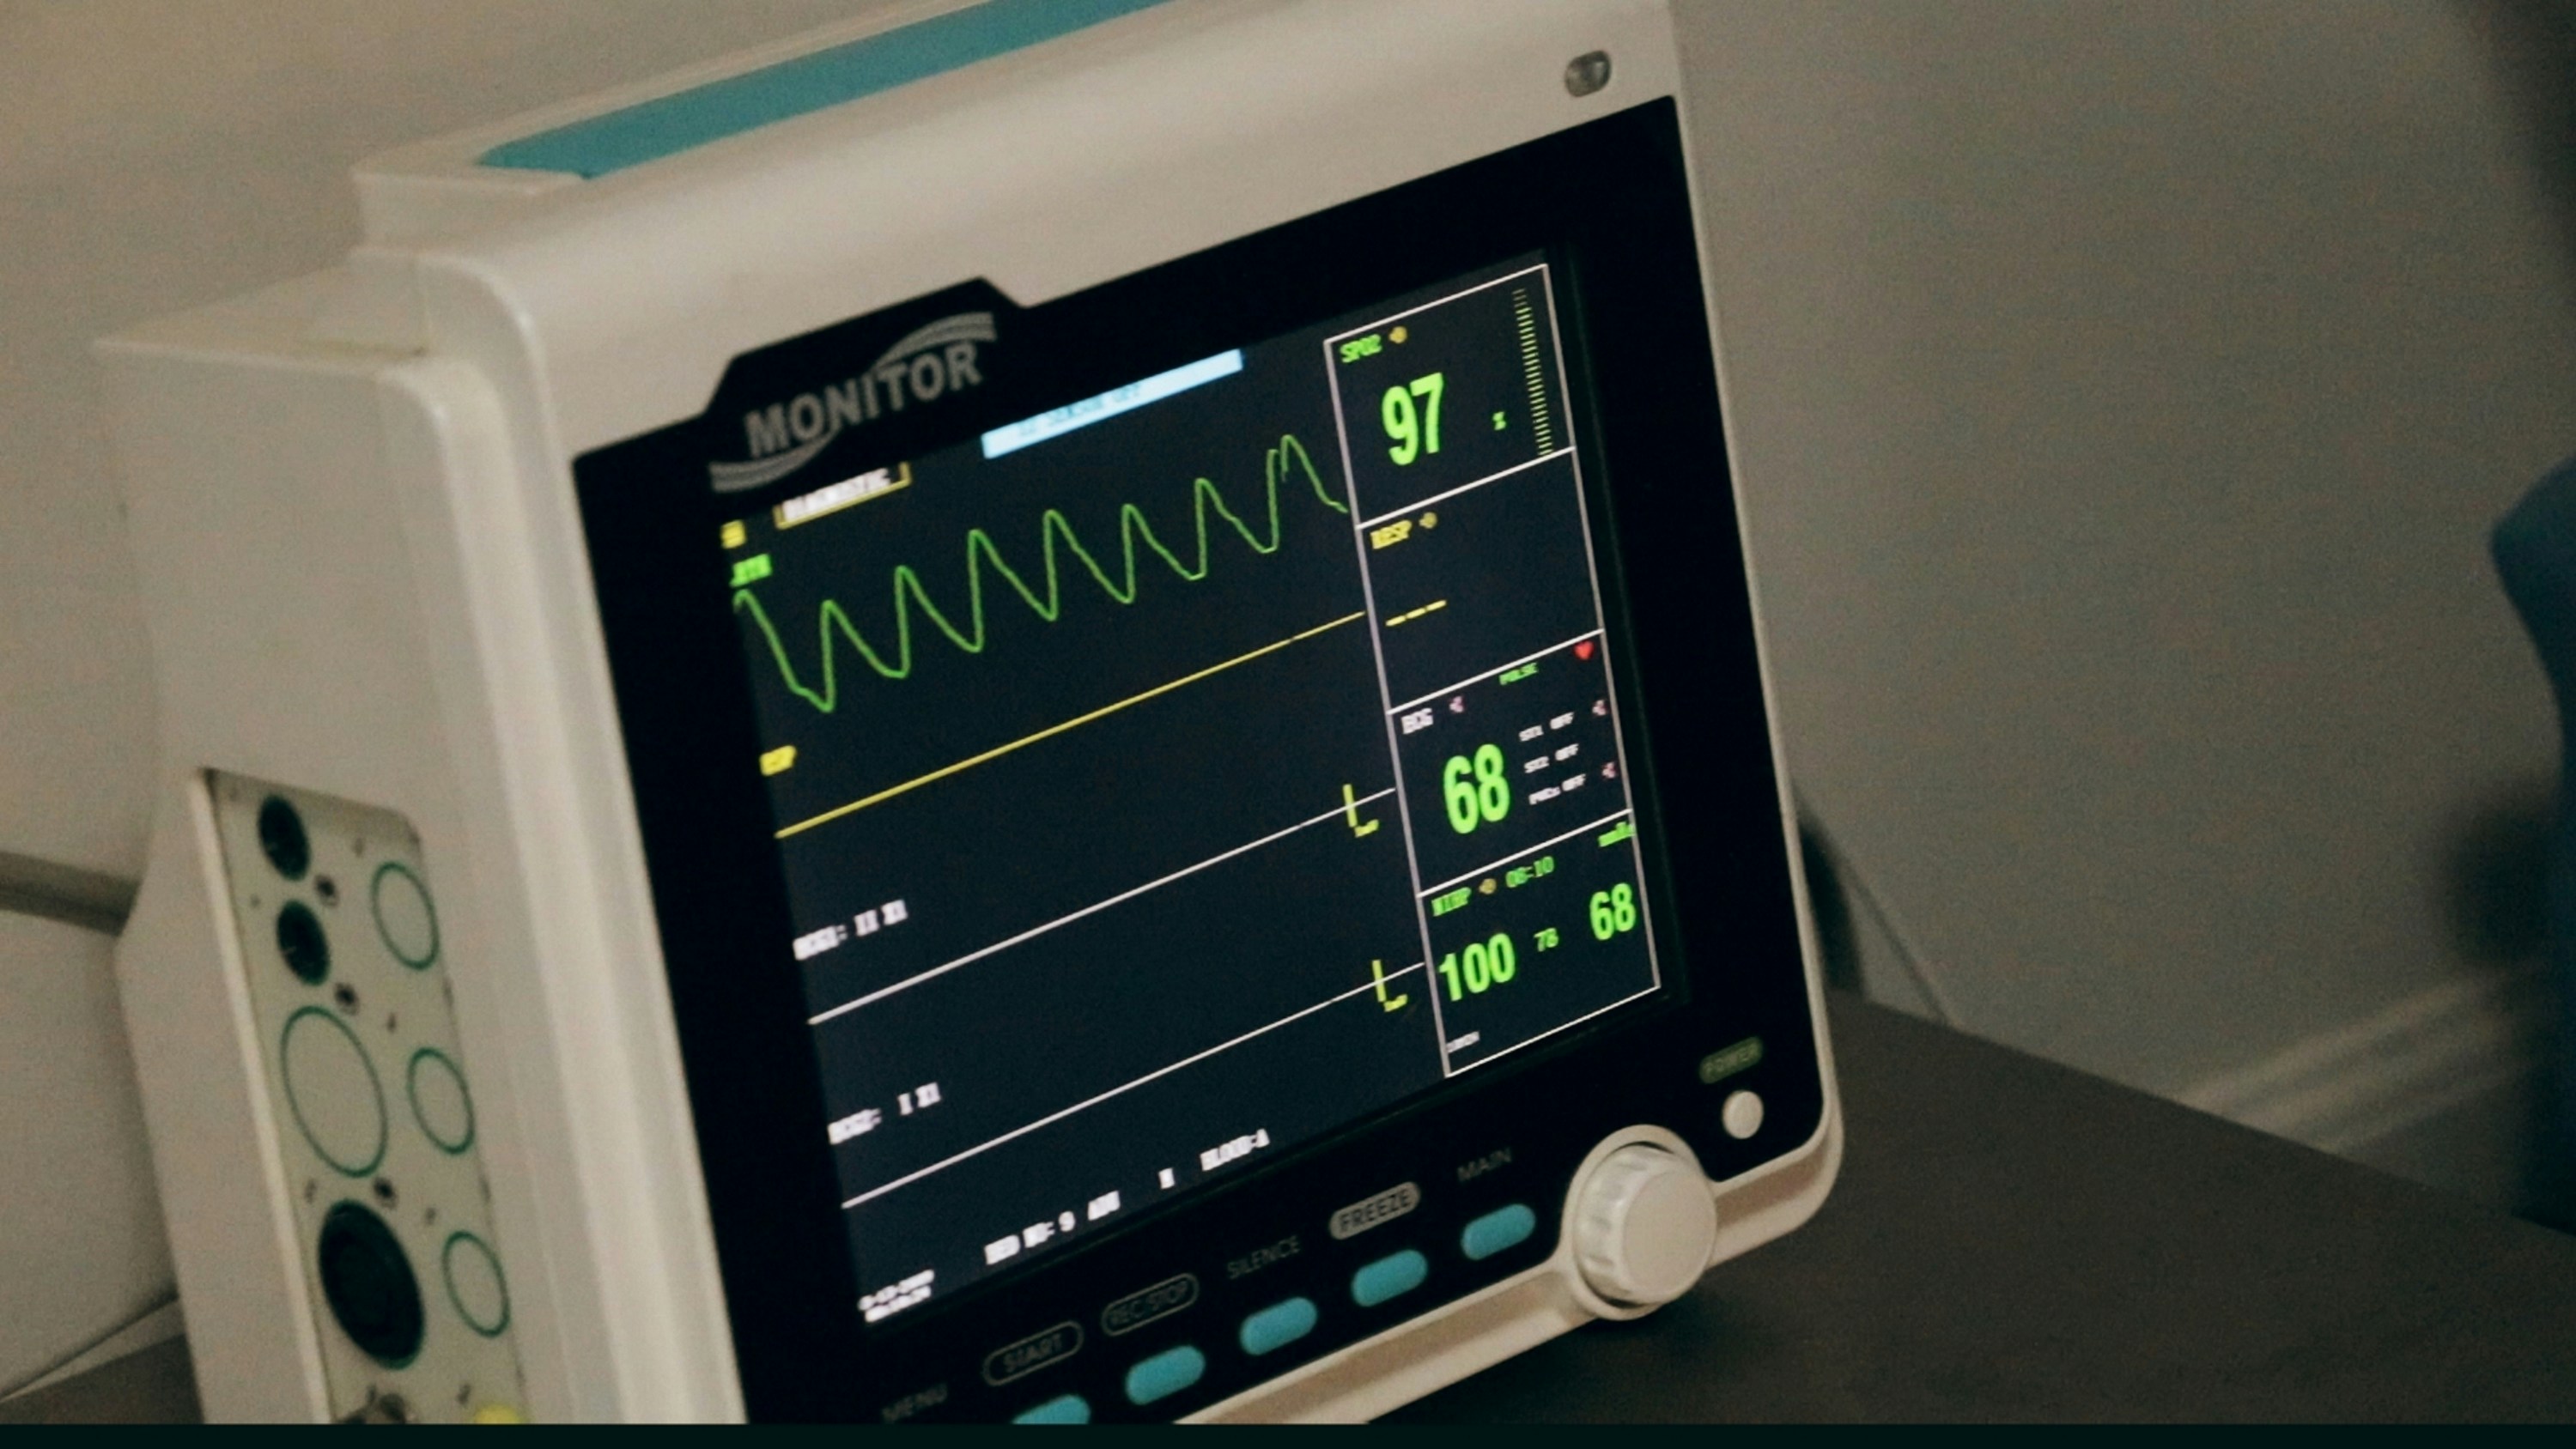
Watch it on a monitor
The reading order on a live monitor: a poor pleth, atrial fibrillation and a slowly falling pressure.
Plays from YouTube when you click. Nothing loads from YouTube before that.
If you want the meaning of each number first, start with what the numbers on a hospital monitor mean. This page is about the routine: how to take in the whole screen without missing anything.
1. Look at the patient before the screen
A monitor measures signals, not people. Someone talking to you in full sentences does not have a saturation of 70, whatever the display says. Start with colour, breathing and how awake they are. Then turn to the screen and ask whether it agrees with what you just saw.
2. Check that every curve is a real signal
Every number on the right is calculated from a curve on the left. If the curve is rubbish, so is the number. Run down the waveforms quickly:
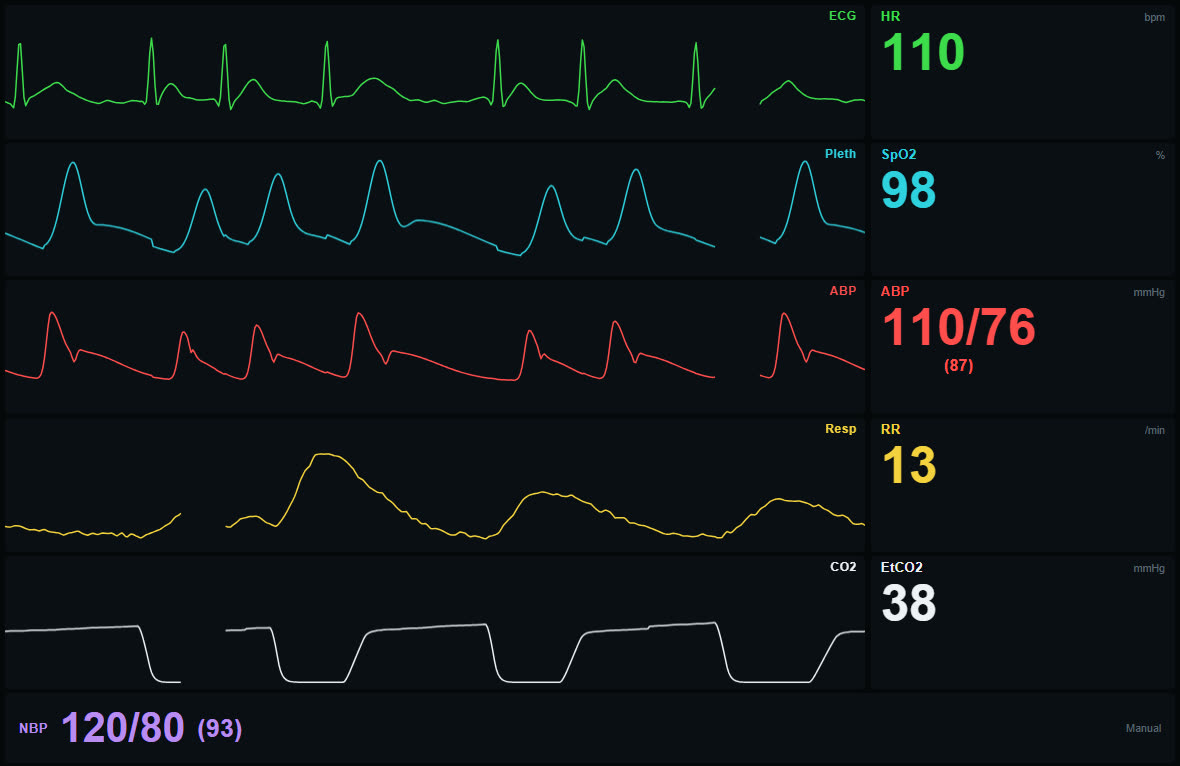
- ECG: a steady baseline with recognisable complexes, not a wandering or fuzzy line.
- Pleth: a regular pulse wave for every heartbeat. Flat or chaotic means the SpO2 can't be trusted.
- Arterial line: a sharp upstroke and a small notch on the way down. A soft, rounded curve can mean the line is damped and the systolic reads too low.
- Capnography: a squarish shape with a plateau for every breath.
3. Rate and rhythm
Now the ECG. Fast or slow, regular or irregular, and is there a P wave in front of each QRS? Then compare the heart rate with the pulse in the pleth or arterial curve. They should match. If the ECG counts 110 and the pulse waves come unevenly with some barely visible, as in the picture below, think atrial fibrillation with a pulse deficit.
4. Oxygen and breathing
SpO2 tells you about oxygenation, respiratory rate and EtCO2 about ventilation, and they fail in different ways. A patient on a lot of oxygen can keep a perfect saturation while CO2 climbs because they are barely breathing. A rising EtCO2 or a falling respiratory rate is often the early sign, and the saturation drops last.
5. Pressure and perfusion
Blood pressure, and above all the MAP. First check which pressure you are looking at: a continuous arterial line or a cuff reading that may be twenty minutes old. Then connect it to the rest of the screen. A low pressure with a fast heart rate and a weak pleth tells a different story from a low pressure with a slow heart rate. The two kinds of pressure are compared in NBP vs ABP.
6. Read the trend, not the snapshot
One value says less than its direction. A heart rate of 105 is nothing special on its own, but it is if it was 80 two hours ago and the blood pressure has dropped 20 points over the same time. Most monitors have a trend view showing the last few hours as a graph. Use it, especially at handover.
7. Alarms
Find out what set the alarm off before you silence it. Many alarms are artefacts from movement or a loose sensor, which is exactly why it is dangerous to get used to them. Check the patient, check the signal, then decide whether the alarm limits suit this particular patient.
Practise the routine
The order becomes automatic through repetition, and a simulator lets you repeat it without a real patient at risk. The instructor changes one value at a time and the student talks through the screen from top to bottom. The simulator here can also let values drift slowly, say a blood pressure falling from 120 to 80 over ten minutes, which is closer to how real deterioration looks than a sudden jump.
Frequently asked questions
What should I look at first on a patient monitor?
The patient. Then check that the curves are real signals, and only after that read the numbers in a fixed order: rhythm, oxygen and breathing, pressure, and finally the trend.
How do I know if the SpO2 reading is reliable?
Look at the pleth curve beside it. A clean, regular pulse wave for every heartbeat means the probe sees proper blood flow. A flat or chaotic curve means the number should not be trusted.
Why can the heart rate and the pulse rate differ?
The heart rate is counted from the ECG, the pulse rate from the pleth or the arterial line. In atrial fibrillation and some other arrhythmias not every beat produces a pulse strong enough to count, so the pulse rate comes out lower.
Can I practise reading a monitor without a real patient?
Yes. With a free simulator an instructor sets the values on a phone and a tablet shows the monitor, so students can practise the routine as often as they like.
Last updated